Arquivos para Data Science

Mug, or not Mug, that is the question!

18 18-03:00 março 18-03:00 2022 — Deixe um comentário

EdgeAI made simple – Exploring Image Classification with Arduino Portenta, Edge Impulse, and OpenMV

Introduction

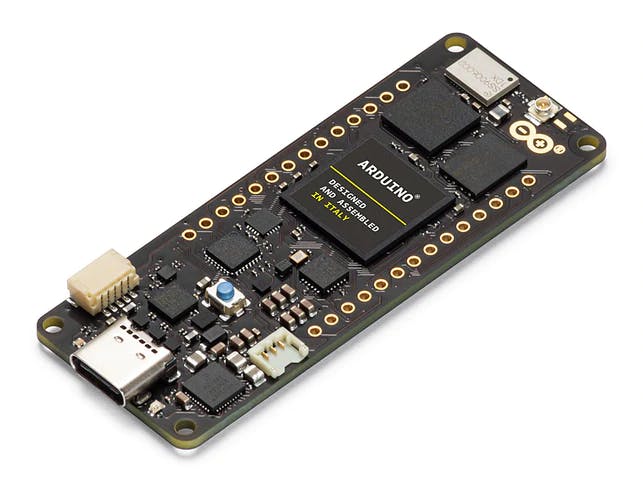
This tutorial explores the Arduino Portenta, a development board that includes two processors that can run tasks in parallel. Portenta can efficiently run processes created with TensorFlow™ Lite. For example, one of the cores computing a computer vision algorithm on the fly (inference), having the other leading with low-level operations like controlling a motor and communicating or acting as a user interface.

The onboard wireless module allows the management of WiFi and Bluetooth® connectivity simultaneously.

image.png

Two Parallel Cores

H7’s central processor is the dual-core STM32H747, including a Cortex® M7 running at 480 MHz and a Cortex® M4 running at 240 MHz. The two cores communicate via a Remote Procedure Call mechanism that seamlessly allows calling functions on the other processor. Both processors share all the on-chip peripherals and can run:

  • Arduino sketches on top of the Arm® Mbed™ OS
  • Native Mbed™ applications
  • MicroPython / JavaScript via an interpreter
  • TensorFlow™ Lite

Memory

Memory is crucial for embedded machine Learning projects. Portenta H7 board can host up to 64 MB of SDRAM and 128 MB of QSPI Flash. In my case, my board comes with 8MB of SDRAM and 16MB of Flash QSPI. But it is essential to consider that the MCU SRAM is the one to be used with machine learning inferences; that for the STM32H747 is only 1MB. This MCU also has incorporated 2MB of FLASH, mainly for code storage.
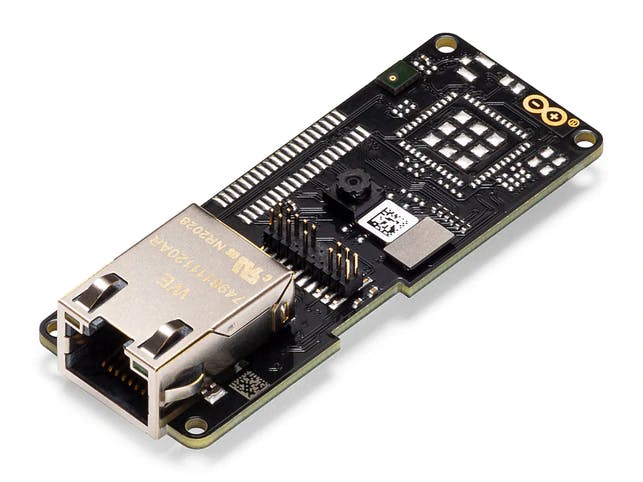
Vision Shield

We will add a Vision Shield to our Portenta board for use in vision applications, which brings industry-rated features, like Ethernet (or LoRa), camera, and microphones.

image.png
  • Camera: Ultra-low-power Himax HM-01B0 monochrome camera module with 320 x 320 active pixel resolution support for QVGA.
  • Microphone: 2 x MP34DT05, an ultra-compact, low-power, omnidirectional, digital MEMS microphone built with a capacitive sensing element and an IC interface.
Continue lendo…

Regression can be hand when classification goes with a high number of classes.

Introduction

The most common TinyML projects by far involve classification. We can easily find examples on home automation (personal assistant), health (respiratory and heart diseases), animal sensing (elephant and cow behavior), industry (anomaly detection), etc.

But what happens when more than a few categories are necessary for a project? Even trying to classify 10 or 20 different categories is not easy. I recently saw a student in our university working on an exciting project. He was trying to find the amount of medicine (ml/cc) on a syringe using images.

image.png

Of course, his first approach was to classify different images of the same syringe, but when he ended with dozens of categories (1cc, 2cc, 3cc… 30cc…), the model started to become complicated. So, another idea was tried: “How about to define the range of volume inside the syringe and to use discrete steps to measure it?”. Well, this could be understood as a regression problem! And that was what was done with great success.

Aditya Mangalampalli developed a similar project, published at Edge Impulse Blog: Estimate Weight From a Photo Using Visual Regression in Edge Impulse. There, Aditya collected a total of 50 images for each 10 grams up to 400 grams, totaling 2050 images. And note that each image on dataset was labelled with the weight it represents:

  • 41 labels: 0, 10, 20, 30, 40, 50, 60, 70, 80, 90, 100, 110, 120, 130, 140, 150, 160, 170, 180, 190, 200, 210, 220, 230, 240, 250, 260, 270, 280, 290, 300, 310, 320, 330, 340, 350, 360, 370, 380, 390, 400.
image.png

You can learn more about using regression with Edge Impulse Studio on the tutorial Predict the Future with Regression Models.

White Wine Quality using Regression

We will use a white wine dataset, public available at the UCI Machine Learning Repository: Wine Quality, for this project. The repository has two datasets related to red and white variants of the Portuguese “Vinho Verde” wine. It consists of a quality ranking and measured physical attributes for 1599 Vinho Verde wines from Portugal. The data was collected from May 2004 to February 2007.

Data provided by P. Cortez, A. Cerdeira, F. Almeida, T. Matos and J. Reis. Modeling wine preferences by data mining from physicochemical properties. In Decision Support Systems, Elsevier, 47(4):547-553, 2009.

DatasetAttribute Information:

Input variables:

image.png

Output variable : quality (score between 0 and 10) – Min = 3 and Max = 9

image.png
Continue lendo…

Sensing the Air Quality

22 22-03:00 agosto 22-03:00 2019 — 1 Comentário

A low-cost IoT Air Quality Monitor based on RaspberryPi 4

santiago_contamination

I have the privilege of living in one of the most beautiful countries in the world, but unfortunately, it’s not all roses. Chile during winter season suffers a lot with air contamination, mainly due to particulate materials as dust and smog.

Chile

Because of cold weather, in the south, air contamination is mainly due to wood-based calefactors and in Santiago (the main capital in the center of the country) mixed from industries, cars, and its unique geographic situation between 2 huge mountains chains.


Nowadays, air pollution is a big problem all over the world and in this article we will explore how to develop a low expensive homemade Air Quality Station, based on a Raspberry Pi.

If you are interested to understand more about it,  please visit the “World Air Quality Index” Project.

Continue lendo…

How safe are the streets of Santiago?

16 16-03:00 agosto 16-03:00 2019 — 1 Comentário

Let’s answer it with Python and GeoPandas!

Costanera Center, Santiago / Benja Gremler

Some time ago I wrote an article, explaining how to work with geographic maps in Python, using the “hard way” (mainly Shapely and Pandas): Mapping Geography Data in Python. Now it is time to do it again, but this time, explaining how to do it in an easy way, using GeoPandas,  that can be understood as Pandas + Shapely at the same package.

Geopandas is an open source project to make working with geospatial data in Python easier. GeoPandas extends the datatypes used by Pandas to allow spatial operations on geometric types.

The motivation for this article was a recent project proposed by our professor Oscar Peredo and developed with my colleagues, Fran Gortari and Manuel Sacasa for the Big Data Analytics course of UDD’s (Universidad del Desarrollo) Data Science Master Degree.

bannerThe objective of that project was to explore the possibility of, taking advantage of state of the art Machine Learning Algorithms, to predict crash risk score for an urban grid, based on public car crash data from 2013 to 2018. By the other hand, the purpose of this article is simply to learn how to use GeoPandas,  on a real problem, answering a question:

“How safe are the streets in Santiago?”.

If you want to know what we have done with the proposed project for our DS Master deegre , please visit its GitHub repository.

Continue lendo…

The idea with this tutorial is to capture tweets and to analyze them regarding the most used words and hashtags, classifying them regarding the sentiment behind them (positive, negative or neutral).

Continue lendo...