Regression can be hand when classification goes with a high number of classes.

Introduction
The most common TinyML projects by far involve classification. We can easily find examples on home automation (personal assistant), health (respiratory and heart diseases), animal sensing (elephant and cow behavior), industry (anomaly detection), etc.
But what happens when more than a few categories are necessary for a project? Even trying to classify 10 or 20 different categories is not easy. I recently saw a student in our university working on an exciting project. He was trying to find the amount of medicine (ml/cc) on a syringe using images.

Of course, his first approach was to classify different images of the same syringe, but when he ended with dozens of categories (1cc, 2cc, 3cc… 30cc…), the model started to become complicated. So, another idea was tried: “How about to define the range of volume inside the syringe and to use discrete steps to measure it?”. Well, this could be understood as a regression problem! And that was what was done with great success.
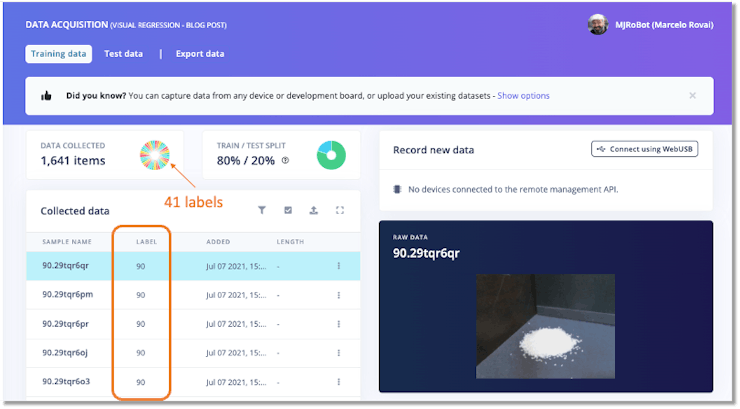
Aditya Mangalampalli developed a similar project, published at Edge Impulse Blog: Estimate Weight From a Photo Using Visual Regression in Edge Impulse. There, Aditya collected a total of 50 images for each 10 grams up to 400 grams, totaling 2050 images. And note that each image on dataset was labelled with the weight it represents:
- 41 labels: 0, 10, 20, 30, 40, 50, 60, 70, 80, 90, 100, 110, 120, 130, 140, 150, 160, 170, 180, 190, 200, 210, 220, 230, 240, 250, 260, 270, 280, 290, 300, 310, 320, 330, 340, 350, 360, 370, 380, 390, 400.
You can learn more about using regression with Edge Impulse Studio on the tutorial Predict the Future with Regression Models.
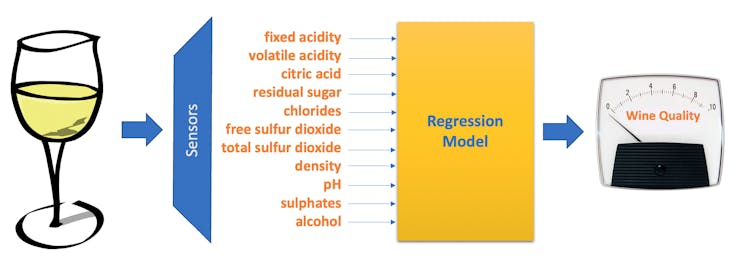
White Wine Quality using Regression
We will use a white wine dataset, public available at the UCI Machine Learning Repository: Wine Quality, for this project. The repository has two datasets related to red and white variants of the Portuguese “Vinho Verde” wine. It consists of a quality ranking and measured physical attributes for 1599 Vinho Verde wines from Portugal. The data was collected from May 2004 to February 2007.
Data provided by P. Cortez, A. Cerdeira, F. Almeida, T. Matos and J. Reis. Modeling wine preferences by data mining from physicochemical properties. In Decision Support Systems, Elsevier, 47(4):547-553, 2009.
DatasetAttribute Information:
Input variables:
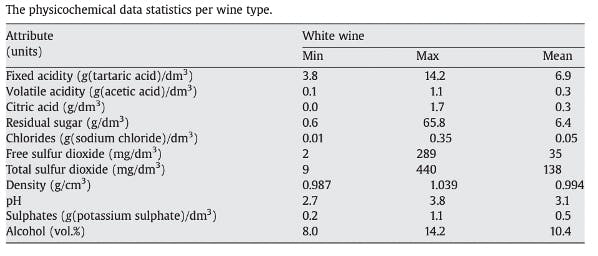
Output variable : quality (score between 0 and 10) – Min = 3 and Max = 9