Can we “hear” a difference between pouring hot and cold water? Amazing proof-of-concept by a quick real deployment using Edge Impulse Studio

Introduction
A few months ago, my dear friend Dr. Marco Zennaro from ICTP, Italy, asked me if I heard that we humans could distinguish between hot and cold water only by listening to it. At principle, I thought that I was the one who did not listen to him well! 😉 But when he send me this paper: Why can you hear a difference between pouring hot and cold water? In an investigation of temperature dependence in psychoacoustics, I realized that Dr. Marco was pretty serious about it!
The first thing that called my attention reading the paper was the mention of this youtube video (please, watch the video and try it yourself before going on with the reading). Uaw! I could easily differentiate between the two different temperatures, only by the sound of water splashing in the cup (could you?) But why did this happen? The video mentioned that the change in the water splashing changes the sound that it makes because of various complex fluid dynamic reasons’. Not much explanation on this. Others say “that the viscosity changed with the temperature” or that it must be something with hot liquid tending to be more “bubbling.” Anyway, according to the paper’s researches, all of this is only speculation.
Besides the scientific investigation on it (what should be very interesting), the question that comes to us was: Is this ability of “listening temperatures” something replicable using Artificial Neural Networks? We did not know, but let’s try to create a simple experience using TinyML (Machine Learning applied to embedded devices).
Uaw! I could easily differentiate between the two different temperatures, only by the sound of water splashing in the cup (could you?) But why did this happen? The video mentioned that the change in the water splashing changes the sound that it makes because of various complex fluid dynamic reasons. Not much explanation on this. Others say that the viscosity changed with the temperature or that it must be something with hot liquid tending to be more bubbling. Anyway, according to the paper’s researches, all of this is only speculation.
Besides the scientific investigation on it (what should be very interesting), the question that comes to us was: Is this ability of listening temperatures something replicable using Artificial Neural Networks? We did not know, but let’s try to create a simple experience using TinyML (Machine Learning applied to embedded devices) and find the answer!
The Experiment

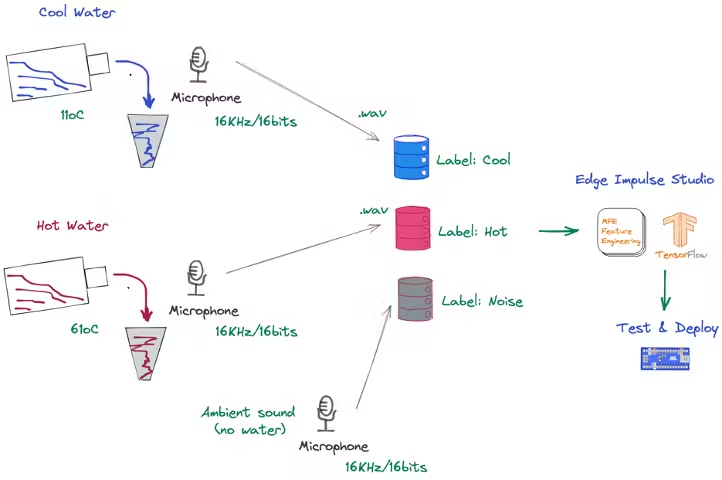
First, this is a simple proof-of-concept, so let us reduce the variables. Two similar glasses were used (same with the plastic recipient where the water was collected). The water temperatures were very different, with a 50oC range between them. (11oC and 61oC).
Each sample was around the time that the glass took to be filled (3 to 5 seconds).
Note that we were interested in capturing the sound of the water only during the pouring process.
The sound was captured by the same digital microphone (sampling frequency: 16KHz. Bit Depth: 16 Bits) and stored as.wav files in 3 different folders:
- Cold Water sound (“Cool”)
- Hot Water sound (“Hot”)
- No water sound (“Noise”).
The Cold Water label should be better defined as “cold” instead of “cool”, but once this is not a scientific paper, was cool leave it as ”cool” 😉
With the dataset captured, we uploaded it to Edge Impulse Studio, where the data were preprocessed, the Neural Network (NN) model was trained, tested, and deployed to an MCU for real physical test (an iPhone was also used for live classification).
Project Workflow

Our Goal with this project is to develop a Sound Classification Model, where hot and cold water could be detected using a microphone (and not a thermometer). The data are collected using an external app (“Voice Recorder”)
The Data Collection will be done externally to EI-Studio and aploaded as.wav files (option 4 on below figure), so for a second phase project more data can be collected by different devices. But it is important to note that raw data (sound in this case) can be ingested to EI-Studio from several ways as directly from a smartphone (option 3) or Arduino Nano (options 1 and 2), as shown in this diagram:

The Data cleaning and Feature Extraction processes will be done in the Studio, as explained in more detail in the next section.
Data Collection

As commented in the Introduction, the sound was captured by a digital microphone, incorporated on a Smartphone (in my case, an Iphone). The important here is to ensure that the sampling frequency is 16 kHz with a Bit Depth of 16 Bits. When the data collection was done, the ambient temperature was 19oC. I am not sure if this influences the data capture, but it is probable. Anyway, the ambient temperature did not change significantly during the experiment.
Two sets of data were collected (Cool and Hot):

The data collected on the smartphone were first uploaded to my computer as.wav files in 3 different folders:
- Cold Water sound (“Cool”)
- Hot Water sound (“Hot”)
- No water sound (“Noise”).

Data Ingestion, Clean and Split

Once the raw data are uploaded to Studio (You should use the option “Upload existing Data”), it is time to clean the data and split it into samples of 1 second each.

Once cleaning the data, 1-second samples with no water sound were saved as “Noise” class.
After having all samples cleaned and split (1 s), around 10% were spared to be used for model testing after training.
Feature Engineering
Sound is a Time Series Data, so it is not easy to classify it directly using a Neural Network model. So, what we will do, is to transform the sound waves in images.
For this purpose, we will use the Studio available option Audio (MFE), which extracts a spectrogram from audio signals using Mel-filterbankenergy features(great for non-voice audio, our case here).

Creating “the Impulse”
An impulse takes raw data (1-second audio samples) with a 500 ms sliding window over it and uses signal processing to extract features (in our case MFE). Having those features (the 1D sound images), the Impulse then uses a learning block, Neural Network (NN), to classify the data in 3 output features (cool, hot, noise).

MFE (Feature Generation)
The parameters of MFE were the default suggested by Studio:
Mel-filterbank energy features
- Frame length: The length of each frame in seconds – 0.02 s
- Frame stride: The step between successive frame in seconds – 0.01 s
- Filter number: The number of triangular filters applied to the spectrogram – 40
- FFT length: The FFT size – 256 points
- Low frequency: Lowest band edge of Mel-scale filterbanks – 300 Hz
- High frequency: Highest band edge of Mel-scale filterbanks – 0 (Sample rate/2)
- Noise floor (sound below this value will be dropped) -52 dB

First, we have very little data. For a real experiment, will be necessary more samples, but at least for this proof of concept, the data seem visually separable. This is the first indication that a NN can work here. Let’s continue our journey!
Neural Network (NN) Model training
The Studio suggests a 1D CNN model architecture with the following main Hyperparameters:
- Number of Epochs – 100
- Learning Rate – 0.005
- Two hidden 1D Conv Layers (with 8 and 16 Neurons respectively
- MaxPooling (padding = same; pool_size = 2; strides = 2)
- For Regularization, Dropout layer (rate = 0.25) after each Conv block
Below is the model summary

After training the model, we got 93.5% of general Accuracy (Quantized – int8), having Cool labeled data doing a little better than Hot. But, again, with such a small amount of data, the result was pretty decent (also, during training, 20% of data was spared to be used as validation).

Using the 10% of Test Data put aside during the data acquisition phase, the accuracy ended in 87%.

Live Classification
Edge Impulse also put available the possibility of a Live Classification with your choice of device. Once a smartphone was used for data collection, the first real test replicates the same ambient where the raw data were collected. The result was fantastic!

Model Deploy
The last part of this experiment will be deploy the model on an MCU (in this case, an Arduino Nano).
We will enable the Edge Optimized Neural (EON™) Compiler, which permits to run of neural networks in 25-55% less RAM, and up to 35% less flash while retaining the same accuracy compared to TensorFlow Lite for Microcontrollers. With that, we ended with an 87% accuracy model that will use 11KB of SRAM and 31KB of Flash (The inference time is estimated in only 17ms).

Building the model as an Arduino Library, it is possible to perform real inference with real data.
The basic code provided by the Studio was changed to include a post-processing block, where the Arduino LEDs will lights-up, depending on the “temperature” of the water, as below:
- Cold Water (label cool) ==> Blue LED ON
- Hot Water (label hot) ==> Red LED ON
- No water (label noise) ==> All LEDs OFF

The result was pretty satisfactory.

- The sound of cold water is almost always detected and never confused with hot water.
- In contrast, hot water is sometimes interpreted as cold (understandable, due to the very little data collected).
Interesting to note that it is clear that cold water sound is related to high frequencies (a whistle can trigger the “blue LED), and scratching a paper over the table that seems to have lower frequencies is related to hot water (trigger the “Red LED”).
Conclusion
This project was a simple experiment (very controlled) but with excellent and promising results. And what is remarkable here is that from the first idea to an actual deployment (“proof-of-concept”), it took only a couple of days (hours in reality), thanks to Edge Impulse Studio.
The next steps are to think about the possible real applications, and having a clear goal is vital to define the dataset to be collected.
Of course, the first goal, was to prove scientifically the “psychoacoustics” idea (described on the paper) with Neural Networks, which we think that it is achievable (as we could see with this simple proof-of-concept). Also, it would be interesting to verify if we can classify more classes (range of temperatures) and why not, thinking about regression resulting on a “sound thermometer”. In this case, I believe that should be connected with the way our brain “sees” it.
Note that the experience was simplified to a most, reducing the possible variables (same recipient and same liquid), but a scientific experience should try different combinations.
For the ones that are curious to learn more about TinyML, I strongly suggest the Coursera free course: Introduction to Embedded Machine Learning | Edge Impulse, or even the TinyML Professional Certificate with HarvardX.
And, if you speak Portuguese, my “TinyML – Machine Learning for Embedding Devices” course, is available on my GitHub.
See you in my next project!
Thank you
Marcelo


