

Regression can be hand when classification goes with a high number of classes.

Introduction
The most common TinyML projects by far involve classification. We can easily find examples on home automation (personal assistant), health (respiratory and heart diseases), animal sensing (elephant and cow behavior), industry (anomaly detection), etc.
But what happens when more than a few categories are necessary for a project? Even trying to classify 10 or 20 different categories is not easy. I recently saw a student in our university working on an exciting project. He was trying to find the amount of medicine (ml/cc) on a syringe using images.

Of course, his first approach was to classify different images of the same syringe, but when he ended with dozens of categories (1cc, 2cc, 3cc… 30cc…), the model started to become complicated. So, another idea was tried: “How about to define the range of volume inside the syringe and to use discrete steps to measure it?”. Well, this could be understood as a regression problem! And that was what was done with great success.
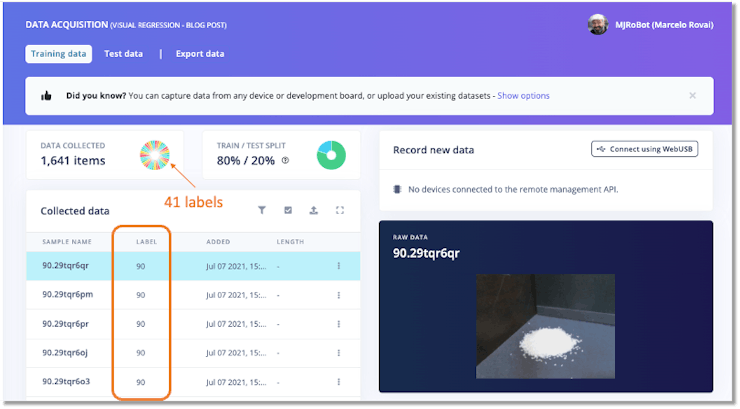
Aditya Mangalampalli developed a similar project, published at Edge Impulse Blog: Estimate Weight From a Photo Using Visual Regression in Edge Impulse. There, Aditya collected a total of 50 images for each 10 grams up to 400 grams, totaling 2050 images. And note that each image on dataset was labelled with the weight it represents:
- 41 labels: 0, 10, 20, 30, 40, 50, 60, 70, 80, 90, 100, 110, 120, 130, 140, 150, 160, 170, 180, 190, 200, 210, 220, 230, 240, 250, 260, 270, 280, 290, 300, 310, 320, 330, 340, 350, 360, 370, 380, 390, 400.
You can learn more about using regression with Edge Impulse Studio on the tutorial Predict the Future with Regression Models.
White Wine Quality using Regression
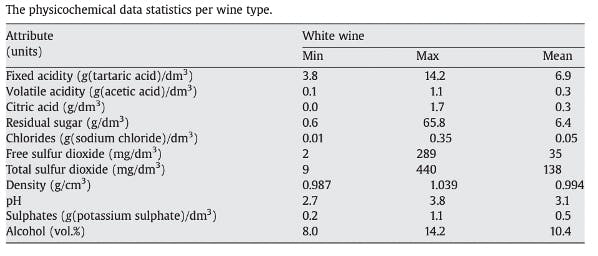
We will use a white wine dataset, public available at the UCI Machine Learning Repository: Wine Quality, for this project. The repository has two datasets related to red and white variants of the Portuguese “Vinho Verde” wine. It consists of a quality ranking and measured physical attributes for 1599 Vinho Verde wines from Portugal. The data was collected from May 2004 to February 2007.
Data provided by P. Cortez, A. Cerdeira, F. Almeida, T. Matos and J. Reis. Modeling wine preferences by data mining from physicochemical properties. In Decision Support Systems, Elsevier, 47(4):547-553, 2009.
DatasetAttribute Information:
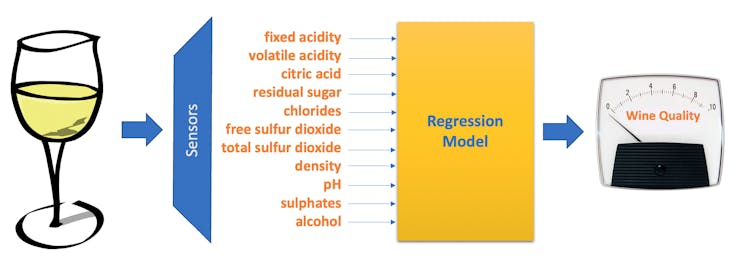
Input variables:
Output variable : quality (score between 0 and 10) – Min = 3 and Max = 9
Once you downloaded the dataset to your computer, you can use Pandas for reading the .csv file:
df = pd.read_csv('./data/winequality-white.csv', delimiter=';')
The 11 input features (or variables) are all float values, and the output is an integer, which should vary from 0 to 10. But with this dataset (4, 898 instances), output goes from 3 to 9 with the following distribution:
sns.countplot(x=df['quality']);

Inspecting the features (Univariate Analysis), we can observe that some of them are skewed, having a different range of values, which suggests that at least we should normalize the data.
To handle skewed data, you can optionally convert them into their log forms for better results.
features_list = list(df.columns[:-1])
df[features_list].hist(bins=30,
                       edgecolor='b',
                       linewidth=1.0,
                       xlabelsize=8,
                       ylabelsize=8,
                       grid=False,
                       figsize=(10,6),
                       color='orange')
plt.tight_layout(rect=(0, 0, 1.2, 1.2))
plt.suptitle('White Wine Univariate Analysis', x=0.65, y=1.25, fontsize=20);

Normalization is rescaling the data from its original range so that all values are within the new range of 0 and 1. Neural Networks work better with features at same range. More information about, please see: How to Use StandardScaler and MinMaxScaler Transforms in Python.
Data Preprocessing
First, we should split the dataset in training (80%) and test (20%) data:
from sklearn.model_selection import train_test_split

X = df.drop('quality', axis=1)
y = df['quality']

X_train, X_test, y_train, y_test = train_test_split(X, y, test_size=0.2, random_state=42)
X_train.shape, X_test.shape
We ended with 3, 918 training samples and 980 for testing.
For Normalization, we will use MinMaxScaler(). The transformer will be created from the feature’s list
from sklearn.compose import make_column_transformer
from sklearn.preprocessing import MinMaxScaler

transformer = make_column_transformer(
(MinMaxScaler(), features_list)
)
and fit on training data:
transformer.fit(X_train)
The transformation will be applied to both train and test data.
X_train = transformer.transform(X_train)
X_test = transformer.transform(X_test)
Edge Impulse expects that the target variables be a string:
y_train = np.char.mod('%d', y_train)
y_test = np.char.mod('%d', y_test)
Edge Impulse Studio Project
Now, go to the Edge Impulse page and create a new project, In my case: White Wine Quality Regression. On Dashboard, go to Keys:
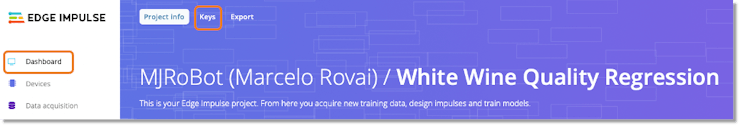
And copy both the API Keys and HMAC Keys.
Now, we need to apply some helper functions to assist in uploading samples to your Edge Impulse Project.
Thanks a lot to ShawnHymel, who made this code available: Classification: Raw Uploader.
Function to construct initial JSON wrapper:
def create_json_wrapper():
    """
    Construct initial JSON wrapper as a template
    """

    # Start with all zeros. Hs256 gives 32 bytes, and we encode in hex.
    # So, we need 64 characters here.

    empty_signature = ''.join(['0'] * 64)

    # Create JSON wrapper for data
    data = {
      "protected": {
          "ver": "v1",
          "alg": "HS256",
          "iat": time.time()              # Epoch time, seconds since 1970
      },
      "signature": empty_signature,
      "payload": {
          "device_type": "pre-made",      # Pre-made dataset (not collected)
          "interval_ms": INTERVAL_MS,     # Pretend it's interval of 1 ms
          "sensors": [
              { "name": SENSORS_NAME, "units": "B" } # Unitless ("Byte" data)
          ],
          "values": []
      }
    }

    return data
send data to Edge Impulse:
def send_sample(data, label, test_set=False):
    """
    Send raw data sample to Edge Impulse project, return HTTP status code
    """

    # Encode message in JSON format
    encoded = json.dumps(data)

    # Sign message
    signature = hmac.new(bytes(EI_HMAC_KEY, 'utf-8'),
                      msg = encoded.encode('utf-8'),
                      digestmod = hashlib.sha256).hexdigest()

    # Set the signature in the message and encode data again to JSON format
    data['signature'] = signature
    encoded = json.dumps(data)

    # Construct URL based on dataset being sent
    if test_set:
        url = 'https://ingestion.edgeimpulse.com/api/testing/data'
    else:
        url = 'https://ingestion.edgeimpulse.com/api/training/data'

    # Upload the data to project
    res = requests.post(url=url,
                      data=encoded,
                      headers={
                          'Content-Type': 'application/json',
                          'x-file-name': str(label),
                          'x-api-key': EI_API_KEY
                      })

    return res
and finally, pull sample and label from the queue and send to Edge Impulse server:
def upload_sample(len_vector, is_test_set):
    """
    Pull sample and label from queue and send to Edge Impulse server.
    To be called within a thread.
    """

    global q

    while not q.empty():

        # Start with empty JSON wrapper
        data = create_json_wrapper()

        # Fill up values field (convert to float to avoid JSON error)
        sample, label = q.get()
        for j in range(len_vector):
            data['payload']['values'].append(float(sample[j]))

        # Send sample
        res = send_sample(data, label, test_set=is_test_set)

        # Check response code
        if (res.status_code != 200):
            print("Failed to upload file to Edge Impulse", res.status_code, res.content)
To use those functions, it is necessary to define the following parameters:
EI_API_KEY = "your API Key"
EI_HMAC_KEY = "your HMAC key"
SENSORS_NAME = "wine_sensors"
INTERVAL_MS = 1
NUM_THREADS = 20
len_vector = X_train.shape[1]
random.seed(42)
The next step is to upload to EI the training set:
#Use many threads to send training data and labels to the Edge Impulse project

# Fill queue with training data and labels
q = queue.Queue()
for i in range(num_samples_train):
    q.put((X_train[i], y_train[i]))

# Create and start threads
threads = []
for i in range(NUM_THREADS):
    threads.append(threading.Thread(target=upload_sample, args=(len_vector, False)))
    threads[i].start()

# Wait for threads to be done
for thread in threads:
    thread.join()
Returning to your Edge Impulse project, you will see the data uploading in real-time.
Now, let’s upload the test data:
### Use many threads to send test data and labels to Edge Impulse project

# Fill queue with test data and labels
q = queue.Queue()
for i in range(num_samples_test):
    q.put((X_test[i], y_test[i]))

# Create and start threads
threads = []
for i in range(NUM_THREADS):
    threads.append(threading.Thread(target=upload_sample, args=(len_vector, True)))
    threads[i].start()

# Wait for threads to be done
for thread in threads:
    thread.join()
On the Data Acquisition section, you can confirm that all data were uploaded correctly:
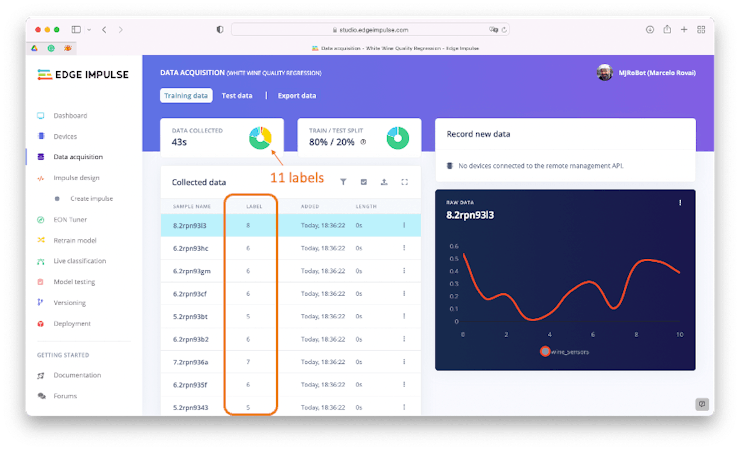
At this point, for Edge Impulse, each instance of the Raw Data seems from one single sensor named: “wine_sensors.” But in fact, the graph shows the values of each of the 11 columns (related to input data). Each set of 11 input features is related to one output label (‘wine quality’).
Note that the curve itself has no meaning.
Impulse Design and Feature Generation
We have already pre-processed the data before the uploading, so let’s choose the input data as “Raw Data”, defining the Window size as 11ms (that is because we previously inform Edge Impulse that “sample rate” was 1ms (or 1KHz):
INTERVAL_MS = 1
This means that the 11 input features will be captured in each window.
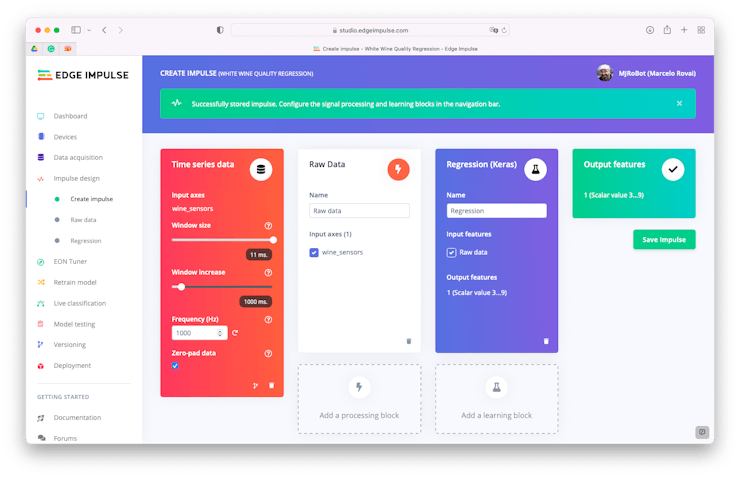
We should go to the “Raw Data” section and generate the features. EI will keep the structure of our tubular dataset.
Under the hood, the output label Y (uploaded as a string) will be converted to integer again and after that to categorical (0, 0….1..0).
classes_values = [ "3", "4", "5", "6", "7", "8", "9"]
classes = len(classes_values)

Y = tf.keras.utils.to_categorical(Y - 1, classes)
Note that classes is a variable that will store the number of unique labels found on output variable Y (‘quality’). In this case 7.
Regression Training
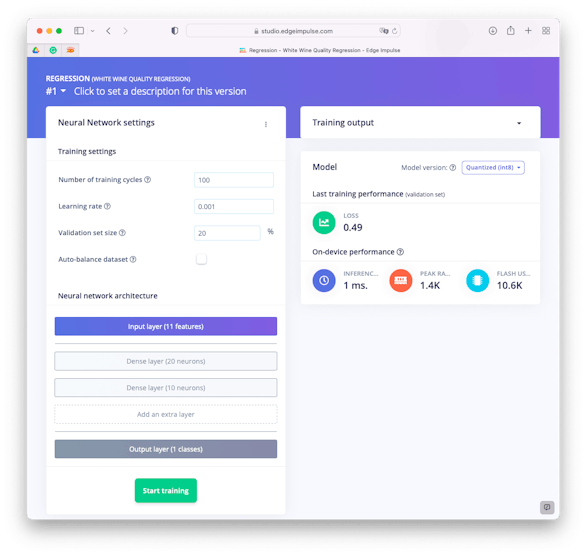
Regarding its design, the DNN (Dense Neural Network) model will have 11 neurons on Input Layer (one per each input feature), 2 sequential hidden Dense Layers with 20 and 10 neurons and an Output Layer with 7 neurons.
The EI visual (simple) mode shows the output layer having 1 class, but this is not what happens under the hood. The output layer has in fact 7 neurons, number stored on variable classes.
# model architecture
model = Sequential()
model.add(Dense(20, activation='relu'))
model.add(Dense(10, activation='relu'))
model.add(Dense(classes, name='y_pred'))
This model is also known as Deep Learning Models for Multi-Output Regression.
Regarding other hyperperameters, the number of epochs (training cycles) will be 100 and learning rate set-up to 0.001. For validation during training, 20% of original train data will be put a part.
As a result, the trained model ended with a Loss of 0.49 (MSE).

Testing
Testing the model over Test Data, we got 100% of “accuracy” and a MSE error of 0.52.
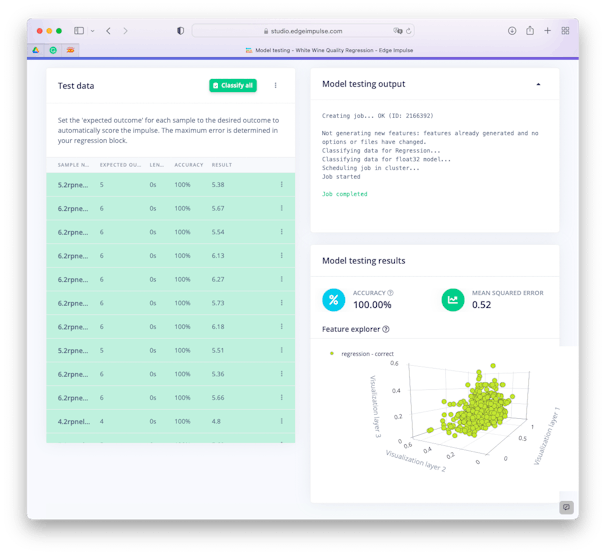
Let’s interpreted what this “accuracy” means. Take one sample, for example the sample 4.2rpnelu3 and see its classification in more detail (you can do it, using the… and [Show Classification] after the sample result on Test Data section).
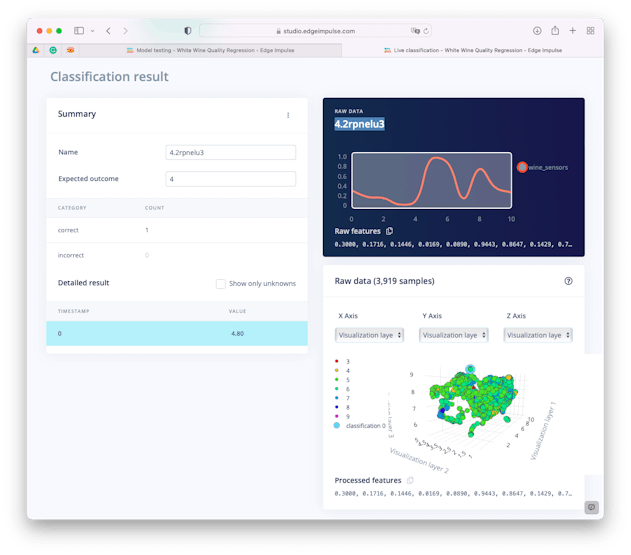
4.2rpnelu3 = [0.3000, 0.1716, 0.1446, 0.0169, 0.0890, 0.9443, 0.8647, 0.1429, 0.7364, 0.3605, 0.2581]
Doing inference on the trained model, the value resultant having the 4.2rpnelu3 sample as input was 4.8, with an error around 0.5, this value could be something between 4.3 and 5.3 or in integer numbers, 4 or 5. Once the expect outcome is 4, it was count as “correct”.
Deploy
The most complicated part is already done! On a real project the model would be easily deployed on a microcontroller (the model will use only 1.4Kb of RAM and around 111Kb of ROM). A simple MCU running an ARM Cortex-M0 CPU would take care of the inference.
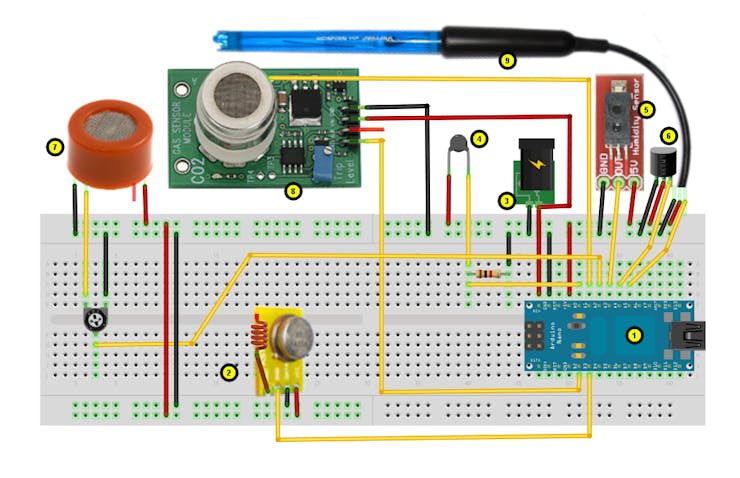
The purpose of this project was to explore Regression Models using Edge Impulse. So, we will not really deploy the project, but it is important to point that automatic Wine Quality tester has a real use on industry, as we can see in the below project, where the authors studied the vinification process of Madeira wine, using several sensors to get data as (e.g. Ethanol, pH, total acid, volatile acid, density, fixed acidity, ash, temperature, humidity, etc.
In another project, Integration of a low-cost electronic nose and a voltammetric electronic tongue for red wines identification, the study tried the identification of red wines that differ in geographical origins, brands, and grape varieties, using a multi-sensor fusion technology based on a novel cost-effective electronic nose (E-nose) and a voltammetric electronic tongue (E-tongue).
Conclusion
The project explored the potencial of regression models, applied to TinyML and Sensor Fusion. On my GitHub repository, you will find notebooks, where I trained and tested the models locally: https://github.com/Mjrovai/tinyML-Regression. Also the project is public on Edge Impulse: White Wine Quality Regression.
As always, I hope this project can help others find their way in the exciting world of Machine Learning!
See you in my next project!
Thank you
Marcelo


